On this page
Session recording and replay
A fault that shows up once every few hours is hard to hand over. Session recording writes every byte every connection sends and receives into a .spulog file, with the time it happened; session replay plays that file back later in a window of its own, at the pace it was recorded — on the same computer or on a colleague's at the office, with no device and no port attached.
A typical case: the engineer on site starts a recording and leaves it running. When the device misbehaves, they press F9 to mark the moment and carry on. Back at the office, someone opens the file, jumps to the bookmark and watches the lead-up to the fault as often as needed, at any speed. Recording is included in Free, so a customer can capture the problem and send it without buying anything.
Everything starts in the main window's File menu:
- File → Record Session… starts a recording; while one runs, the same item reads Stop Recording;
- File → Add Bookmark (F9) marks the current moment on the focused connection;
- File → Open Recording… opens a
.spulogrecording, or a JSON Lines file saved by File → Export Session…, in a replay window; - File → Replay This Session replays what SPU holds from this session, without saving anything first.
A replay only draws. Replayed data never goes to a port, never triggers an auto reply and never enters a bridge, so a recording can be replayed while the same device is connected.
Recording on site
File → Record Session… asks for three things:
- File: where to write the recording. It suggests
SPU-<date>-<time>.spuloginDocuments/SPU Recordingsand remembers the folder you choose. An earlier recording is never replaced without asking. - Start with what SPU already holds from this session: on by default. SPU keeps each connection's recent traffic in memory (2 to 8 MB per connection, 32 MB in all), and the box says how much it holds, for example "2 ports, 3.21 MiB since 13:40". With it on, the fault you saw just before you thought of recording is in the file too.
- Start a new file every 100 MB: a long recording is split into parts (
…-part2.spulog,…-part3.spulog, …), each between 16 and 2048 MB. When a replay reaches the end of a part, a line offers to Open the next one.
Click Start Recording. Every connection in the window is recorded, both directions merged in time order, until you stop. Connections added later join in; a change of settings, a port opening or closing and a connection leaving the window are noted in the file. Opening another project does not stop the recording, and closing SPU ends it properly.
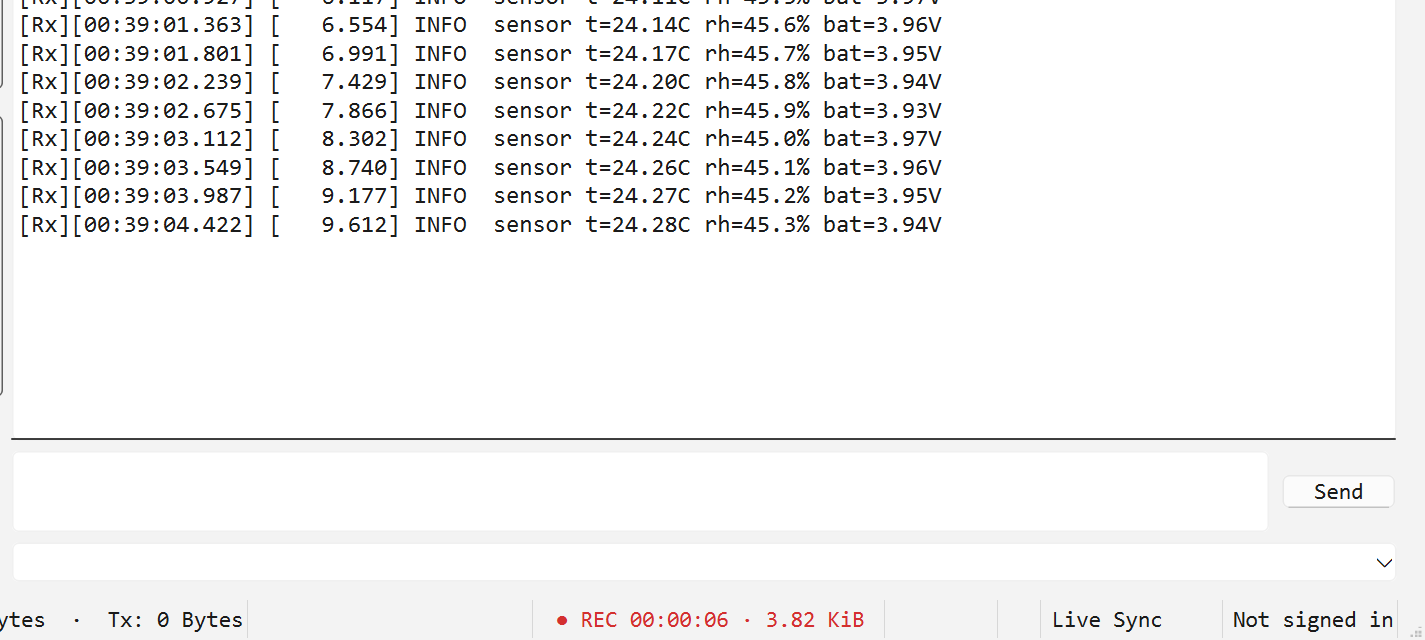
While it runs, the status bar shows a red ● REC with the length and size so far. Click it for Stop Recording, Add Bookmark, Show in Folder and Replay This Recording, which opens the file as written so far.
The file is written every 250 ms. If SPU or the computer stops unexpectedly, at most the last fraction of a second is lost and the file still opens; the replay window says that the recording ends mid-line. If a write fails — a full disk, a USB drive pulled out — the recording stops at once and says why, and what was written stays readable. In the Mac App Store version the recording is always one file, and the save panel asks where to put it each time.
F9 marks the moment on the focused connection. Nothing pops up and there is nothing to type, so the moment is not lost; the bookmarks are called Bookmark 1, Bookmark 2, … and are named later in the replay window. F9 works when nothing is being recorded too: the bookmark stays with the session and goes into a recording started later with "Start with what SPU already holds", into Replay This Session and, as a note, into the connection's session export and diagnostic pack.
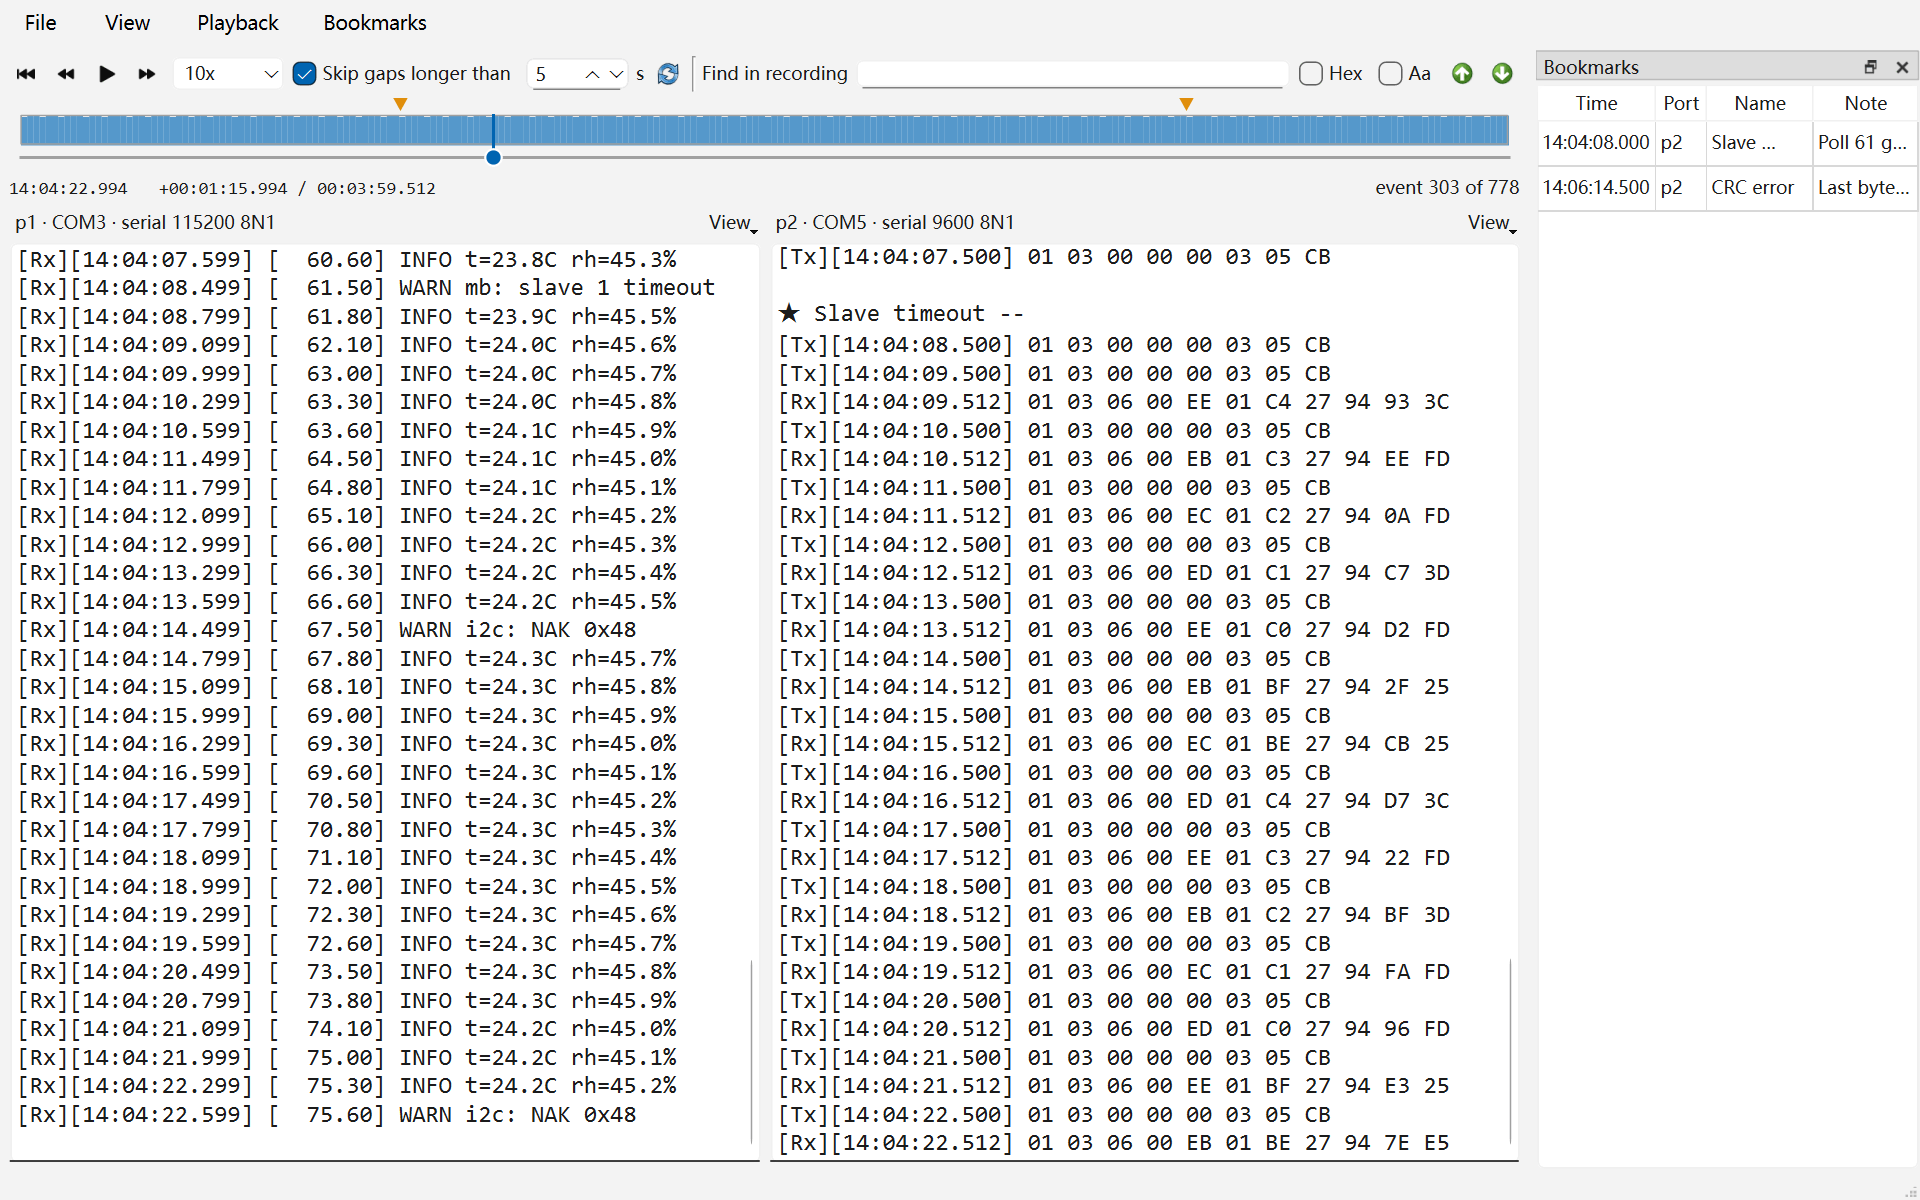
The replay window
File → Open Recording… opens the recording in a window of its own. Several can be open at once, one per window, and they close with SPU. A large file is read once, with a progress bar; after that any moment in it can be reached straight away.
Each connection in the recording gets a view, side by side; View → Arrange Vertically stacks them. The first four are shown, and View → Ports shows or hides each one. A view's title gives the port and its settings as they were at the playhead.
Each view has its own View ▾ menu: Received and Sent as Hex or Text, Received Encoding and Sent Encoding, Timestamps, Show Sent Data, Zoom In, Zoom Out and Reset Zoom — and two panels that replay on the recording's clock:
- Plot draws the numbers in the data as curves, spaced as they arrived; see Real-time plot;
- Protocol Decode lists the traffic as frames, with the round-trip times of the original; see Protocol decode view. Frame templates are those of the main window.
Right-click in a view for Copy Selection As (C array, hex dump or hex bytes), Save Selection As…, Find… within that view, and Add Bookmark Here.
Under the timeline, a line gives the time at the playhead, the time since the start against the whole length (+00:12:34.567 / 01:05:00.000) and which event of how many is on screen. Times are shown in this computer's time zone; when the recording was made in another one, hovering over the time says where, for example "Recorded in Asia/Shanghai (UTC+08:00)".
Playing it back
The toolbar holds Go to Start, Step Back, Play / Pause and Step Forward, then:
- Speed: 0.25x, 0.5x, 1x, 2x, 5x, 10x, 100x or Fastest. At 1x the data appears with the gaps it had on the wire. When the views cannot keep up — 100x on a busy line — the status bar says so and the data is shown as fast as it can be.
- Skip gaps longer than 5 s: on by default. Any silence longer than this plays as that many seconds (1 to 60), so an hour spent waiting for a fault does not have to be sat through again. Turn it off to keep every gap as it was. The speed and this setting are remembered.
The timeline shows how busy the traffic was across the whole recording, the bookmarks as marks above it, and the playhead. Click anywhere to go there; drag to scrub, with the time following the mouse, and release to go. Hover over a mark for the bookmark's name and time; click it to jump. Playback → Go to Time… goes to a clock time, to the millisecond.
After a jump each view is redrawn with the data that led up to that moment, so there is always context; a line -- Showing from … -- marks where the redrawn part begins. Step Forward shows the next piece of data — one read or one send — on the connections shown, and Step Back takes the last one away again.
| Key | In the replay window |
|---|---|
| Space | Play / Pause |
. and , |
Step Forward / Step Back |
| Home | Go to Start |
| Ctrl+G | Go to Time… |
| Ctrl+Shift+F | Find in Recording |
| F9 | Add Bookmark at the playhead |
] and [ |
Next Bookmark / Previous Bookmark |
| Ctrl+S | Save Bookmarks |
| F5 | Reload: read what a growing file has added |
| F11 | Full Screen |
| Ctrl+W | Close |
On macOS, use ⌘ in place of Ctrl. Space goes to a button, box or list that has the focus, as usual.
Find in Recording
The Find in recording box on the toolbar (Playback → Find in Recording, Ctrl+Shift+F) searches the whole file, including the part not played yet, and goes straight to the match: Enter or Next match searches forward from the playhead, Shift+Enter or Previous match backward. The views are drawn up to the end of the match, and the match is highlighted.
- Text is looked for in the receive encoding of the first view shown. Tick Hex to type bytes instead, such as
48 65; Aa matches case. - It searches the connections on show, in both directions, the notes in the recording (a port closing, for example) and the bookmark names.
- A reply that arrived in two reads, as it often does on a serial line, still matches. Data from different ports, directions or TCP clients is never joined into one match.
- A large file is searched in the background, with the progress on the status bar; Esc stops it.
Find… in a view's right-click menu searches only what that view shows.
Bookmarks and loops
The Bookmarks list on the right (Bookmarks → Show Bookmark List) gives each bookmark's time, port, name and note. Bookmarks come from F9 on site, from F9 in the replay window (at the playhead, on the view that has the focus) and from Add Bookmark Here in a view's right-click menu (at the line clicked).
- Double-click a Name or a Note to edit it; double-click the time or the port to jump there. Delete removes the bookmarks selected.
]and[go from one to the next. As playback passes a bookmark, it appears as a line in the view.- File → Save Bookmarks (Ctrl+S) saves them into the recording itself, so whoever gets the file gets the bookmarks. The title bar shows
*while there are unsaved changes, and closing the window asks. A file that cannot take them — read-only, still being recorded, or the temporary file of Replay This Session — keeps them through File → Save a Copy… instead.
To play one stretch over and over — for a demonstration, or to watch a fault until it makes sense — select one bookmark in the list (the stretch runs to the next bookmark) or two (the stretch between them) and click Loop Between Bookmarks. Playback goes round it until you click it again, and the stretch is shaded on the timeline. For a room, View → Full Screen (F11) and each view's zoom make it readable on a projector.
This session, and a file still being written
- File → Replay This Session replays what SPU holds in memory from this session — each connection's recent traffic — with the F9 bookmarks made in it. Nothing needs saving first: the replay is a temporary file, removed when its window closes. File → Save a Copy… keeps it as a
.spulog, bookmarks included. - A recording can be opened while it is still being written, with Replay This Recording on the REC menu or with Open Recording. File → Reload (F5) reads what has been added since, and the playhead stays where it was. Save its bookmarks once the recording has stopped, or save a copy.
Sending and exporting
- Send the file. A
.spulogholds everything the connections sent and received, their names and settings, and the bookmarks saved into it. A recording in parts needs all its parts, kept together in one folder. Check what is in a recording before sending it outside your company. - Scripts can read it. A
.spulogis JSON Lines, the same format as the JSON Lines of File → Export Session (see Exporting data and the diagnostic pack). - File → Export Range… saves part of a recording as JSON Lines, CSV or Text: the loop, when one is on; else the stretch between the bookmarks selected in the list (two or more); else the whole recording — always only the connections shown.
- File → Save a Copy… writes the whole file, with its bookmarks, under another name.
Free and SPU Pro
Free covers everything needed to capture a problem and hand it over:
- recording, with parts and F9 bookmarks, with no limit on length or on how often;
- opening recordings, the timeline, bookmarks (naming, notes and saving them) and Find in Recording across the whole file.
In Free, replay plays the first 10 minutes of each recording:
- the timeline shows the whole recording, with the part after 10 minutes hatched; bookmarks there are still listed, and a jump to one stops at the 10-minute mark;
- Find in Recording counts the matches after the 10 minutes without showing them;
- the 10 minutes count from the start of the recording, not of each part, so the later parts of a long recording have none of their own;
- Replay This Session takes the most recent 10 minutes of the session;
- Export Range writes the most recent 500 records of each connection in the range;
- Plotting and decoding in a replay are not counted: they use none of the 120 plotting seconds or 120 decoding seconds that the live connections have each time SPU starts, so the same data is never charged twice. The limits that use nothing up still apply: the plot draws the first 2 channels, and only the first frame template decodes.
The first time playback reaches the limit, SPU says so once per session; after that a line above the views shows where the limit is, with Learn about SPU Pro.
SPU Pro replays whole recordings and everything SPU holds from the session, and Export Range writes the whole range, up to 64 MB at a time.