On this page
Web remote debugging with Live Console
The site computer and remote browser only need Internet access, so you can connect from anywhere.
The browser does not need a route to the site's IP address, and the site does not open an inbound TCP port. The connection therefore works across locations and NAT.
Live Console shows the port list and live TX/RX traffic, sends data to a selected port, and can open, close or reconfigure ports remotely.
Live Console is a live window, not a transparent pipe: it carries frame-limited text events, not the byte stream itself. When the remote end needs a real port — a protocol run end to end, a file transfer, a firmware update — use Live Relay instead; for the trade-off between all remote paths, see Choosing a remote access path.
This page covers the feature itself. For the full workflow between someone at the device and a remote engineer, see Debug a serial port from anywhere on the Web.
Enable it on the desktop (device side)
Every switch here is off by default; turn on only what the task needs. (A fourth consent switch in the same menu, Live Relay, belongs to Live Relay.)
- Sign in inside the application (Cloud menu → Sign In); the device is bound to your account.
- Check Cloud → Live Console, or click Live Sync in the status bar and pick it there — the same switch, and the cell then reads Shared, or In use while somebody is watching. The device keeps a heartbeat with the cloud and shows as online in the web device list.
- Check Allow Remote Send only if you want to send data from the web; without it the console is view-only.
- Check Allow Remote Port Control only if you want to open/close ports or change parameters from the web; it is independent of Allow Remote Send.
Use it on the web (cloud side)
The switches above decide what is possible here: with only the main switch on, the console is view-only; sending and port control are released by the other two.
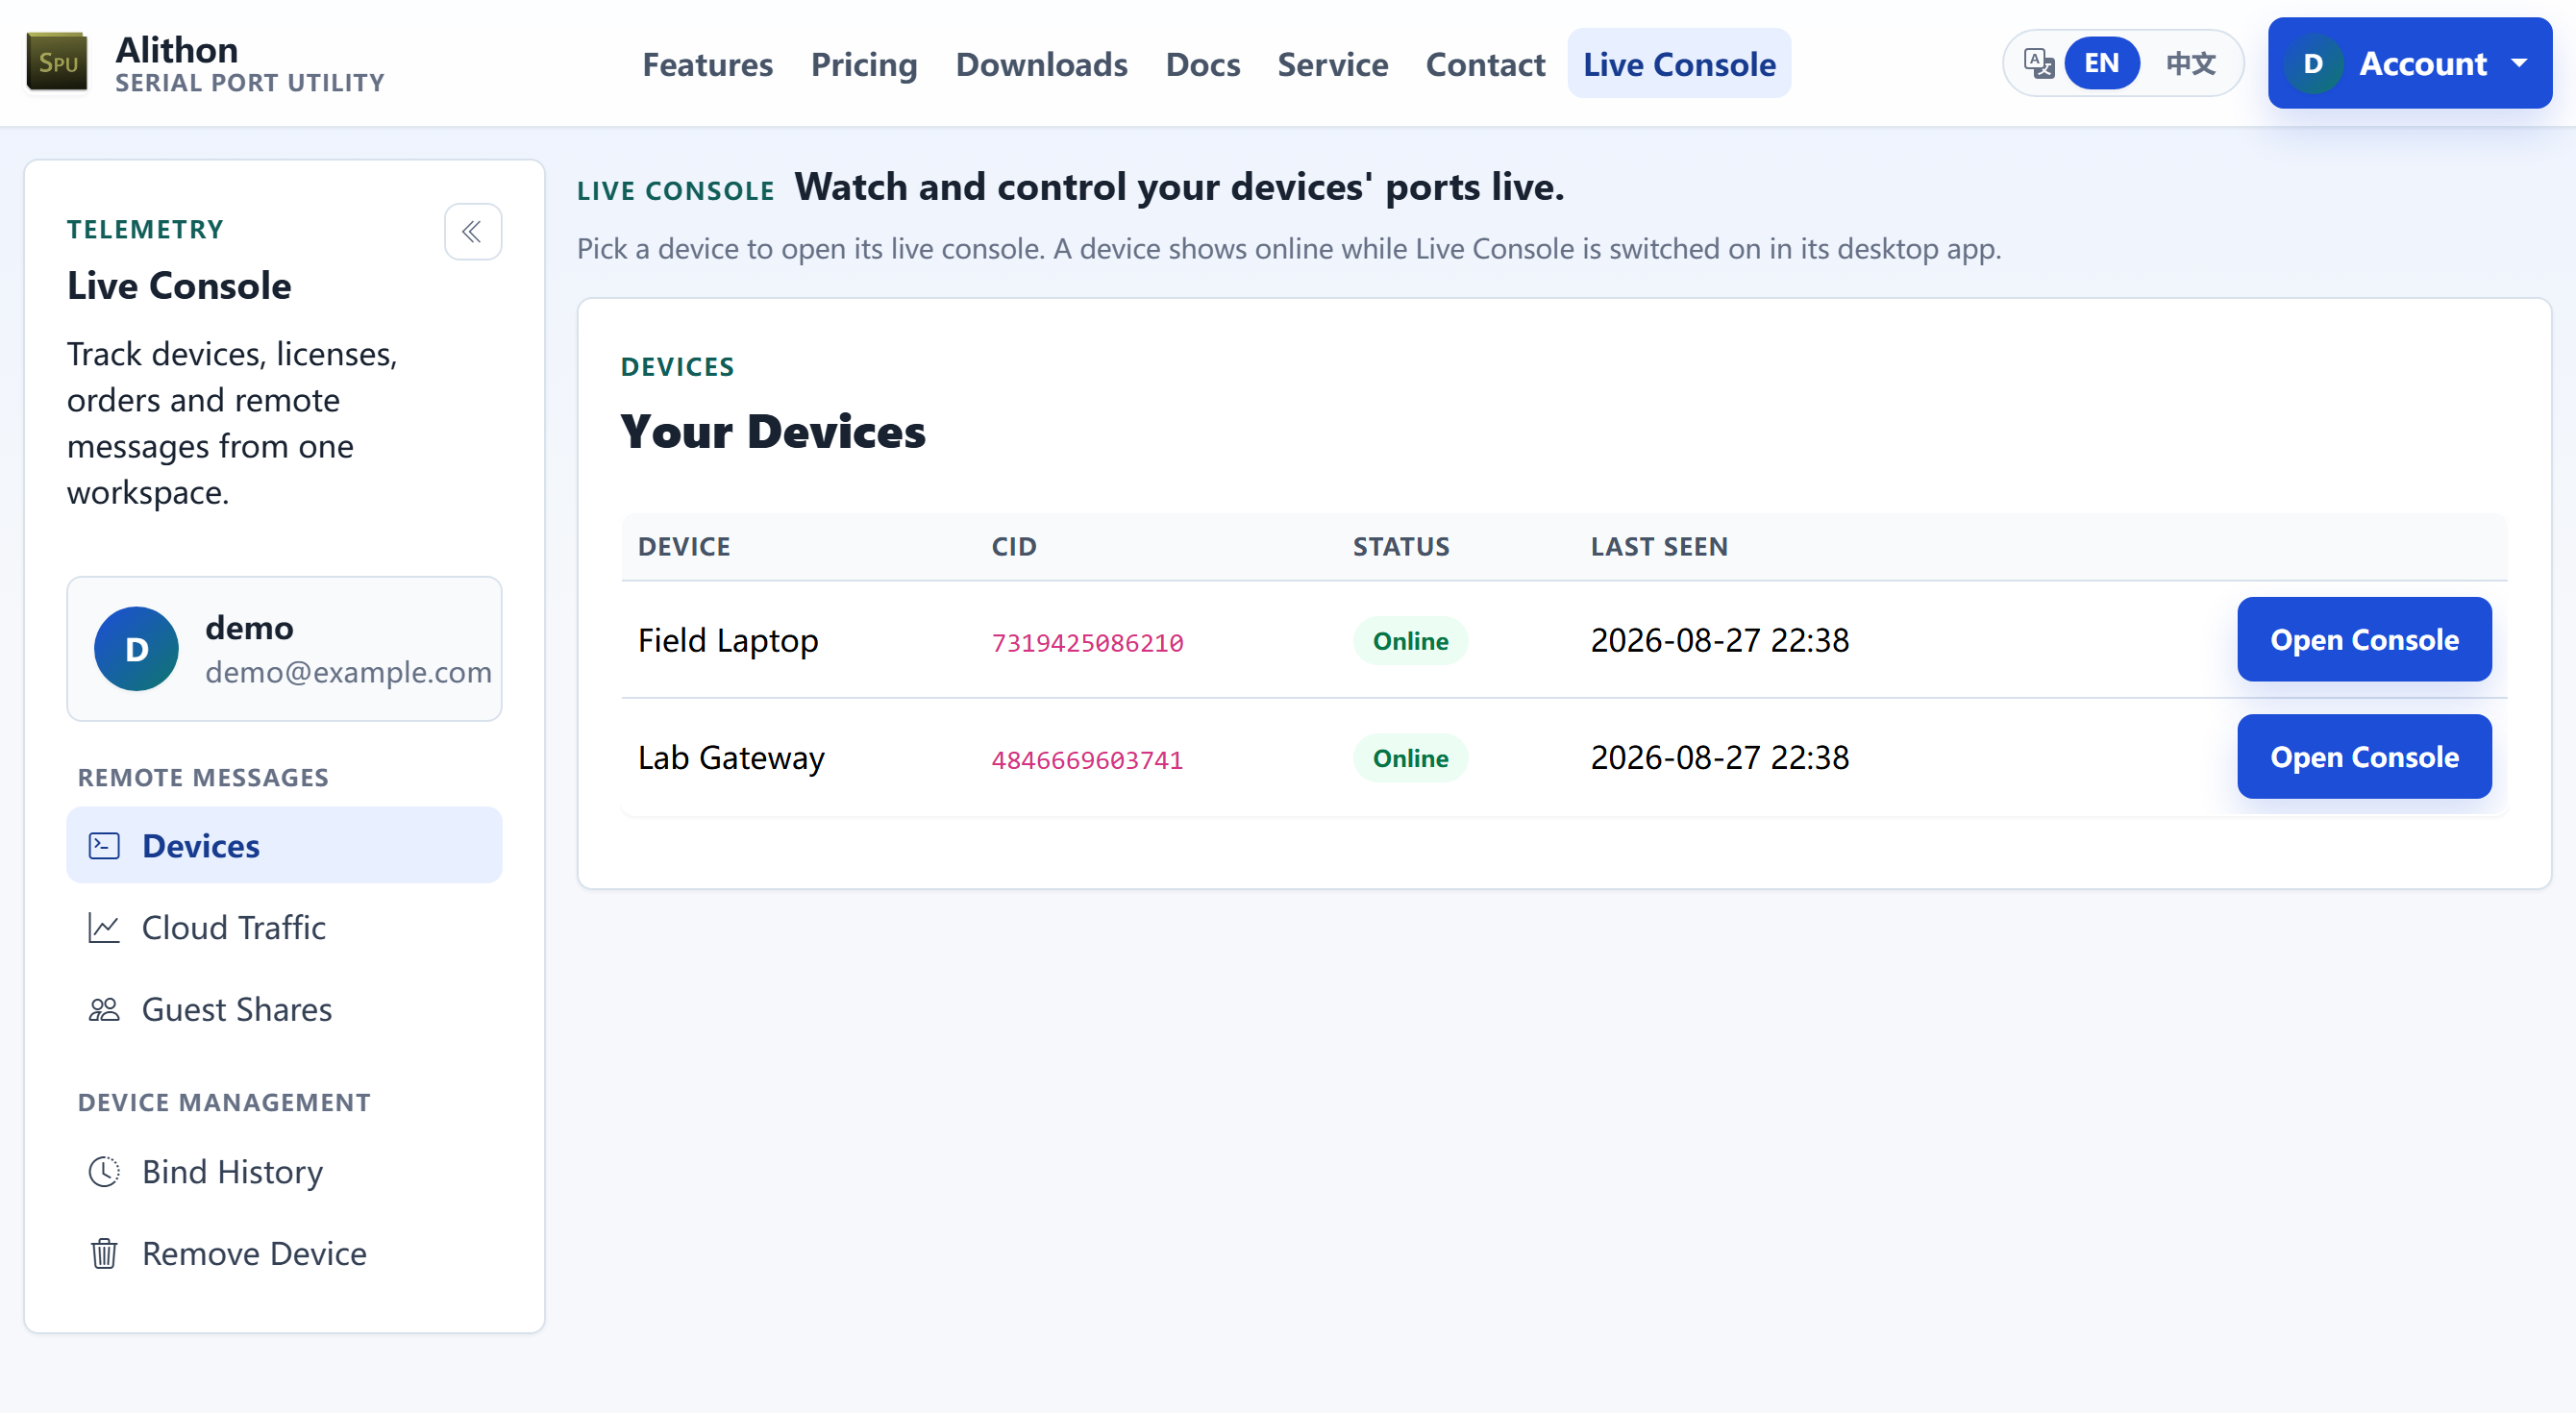
- Sign in at alithon.com, open "Live Console" in the top navigation and pick "Devices" in the sidebar.
- The device list shows each bound device by name, CID, status and last seen; the CID is what tells two identically named machines apart. Click "Open Console" to enter the device page.
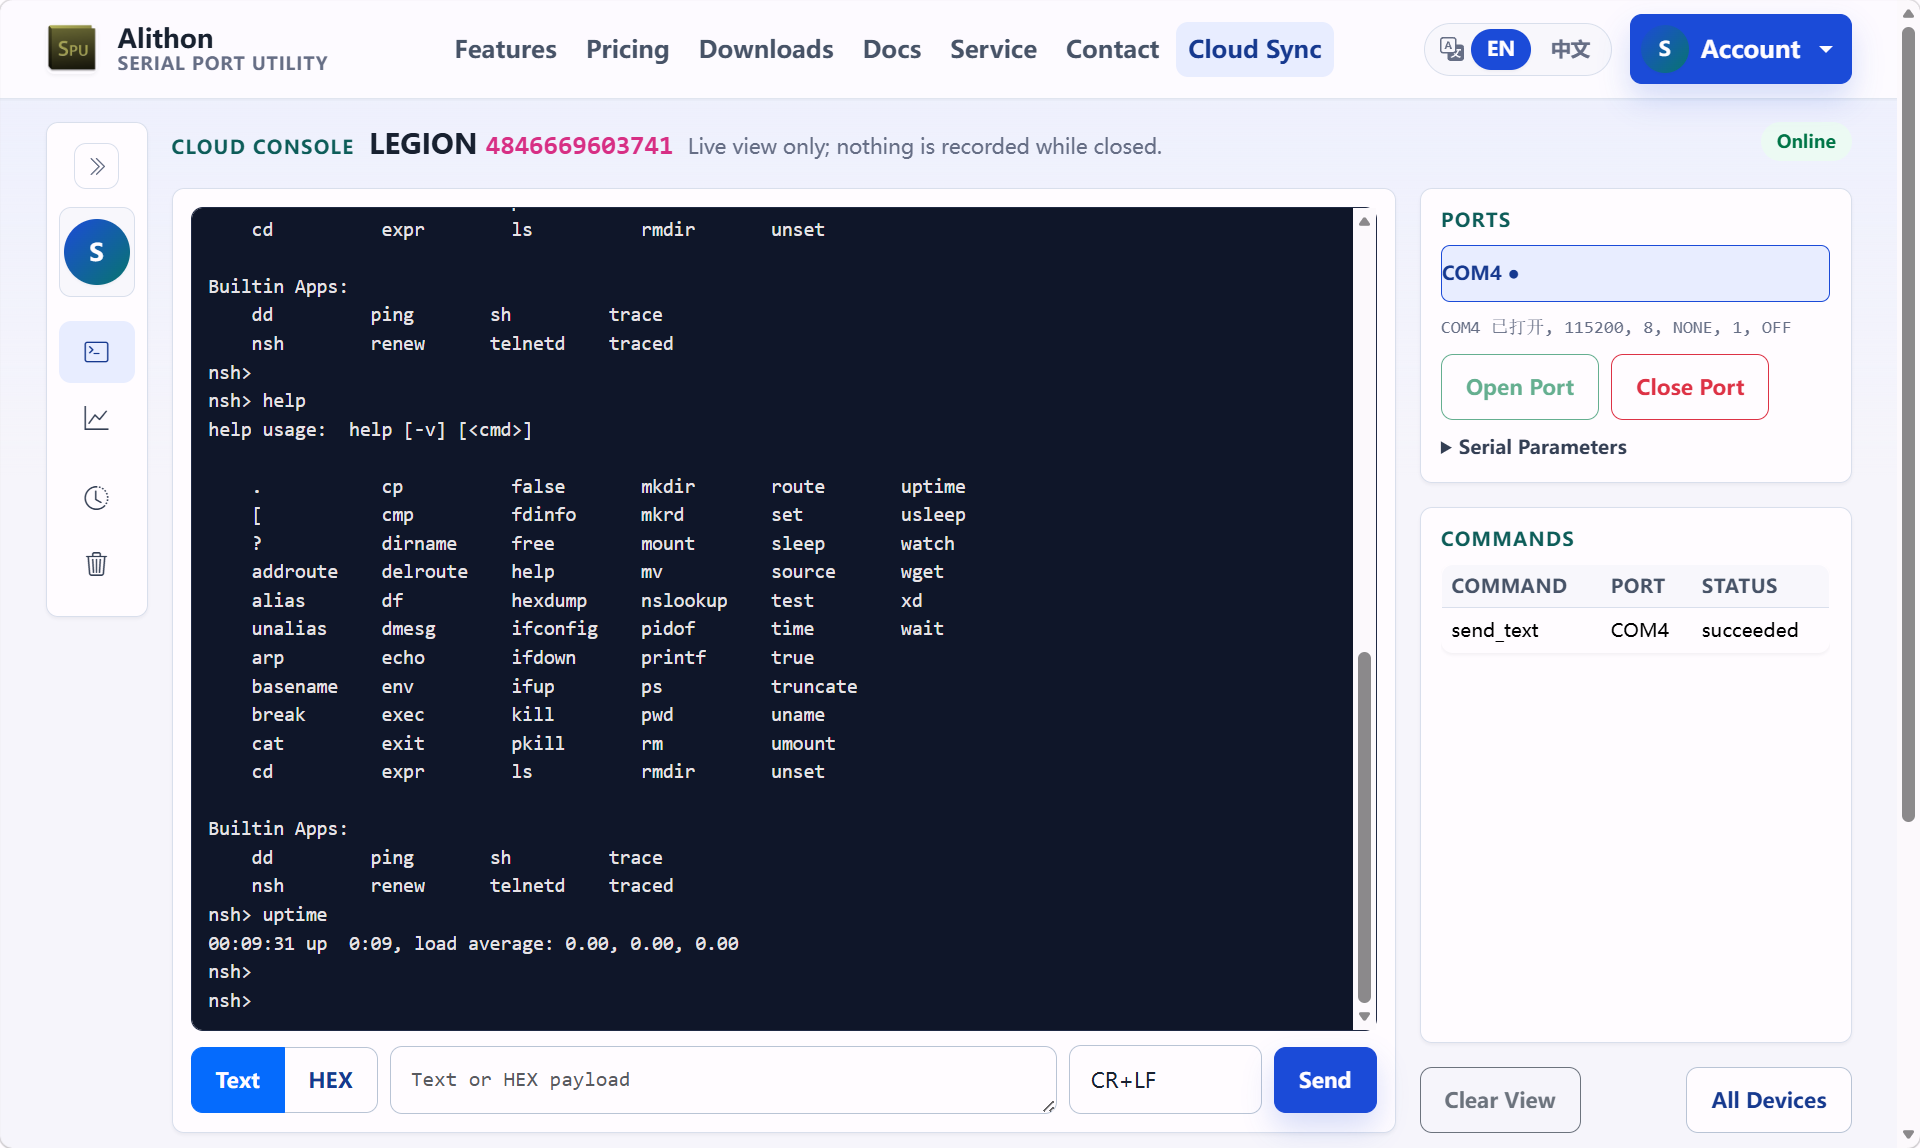
- The "Ports" panel on the right lists the device's ports under the same names as the desktop, for example
COM3orTCP Client 192.168.1.10:5000. Select one to watch its live RX log on the left. - Open and close the port from the buttons under that list; expand "Serial Parameters" in the same panel to change the baud rate and framing.
- In the send area on the left choose Text or HEX (for example
AA55010203) plus a line-ending suffix, then send to the selected port. - The "Commands" panel on the right shows each remote command's state and failure reason.
Good to know
- A live window, not a recorder: nothing is uploaded while nobody is watching, the page only shows traffic from the moment you open it, and the cloud keeps no history. Use desktop log files for complete records.
- Waking up can take up to about 30 seconds after you open the page: the device learns about the viewer on its next heartbeat, then starts uploading the port list and events.
- The live buffer is small: under heavy traffic the oldest lines are dropped and the log shows a "some log lines were dropped" notice.
- A succeeded command only means the desktop wrote every byte to the port. It does not mean the target device received, understood or answered — judge that from the RX log that follows.
- Common failure reasons: permission_denied (the matching desktop switch is off), port_closed (the target port is not open), commands are rejected while the device is offline, and unanswered commands are marked timeout.
- No error pop-ups: account and cloud-sync network or server errors surface as a brief note on the desktop status bar (hover it for details) instead of a dialog, so they never interrupt local debugging.
Traffic and quota
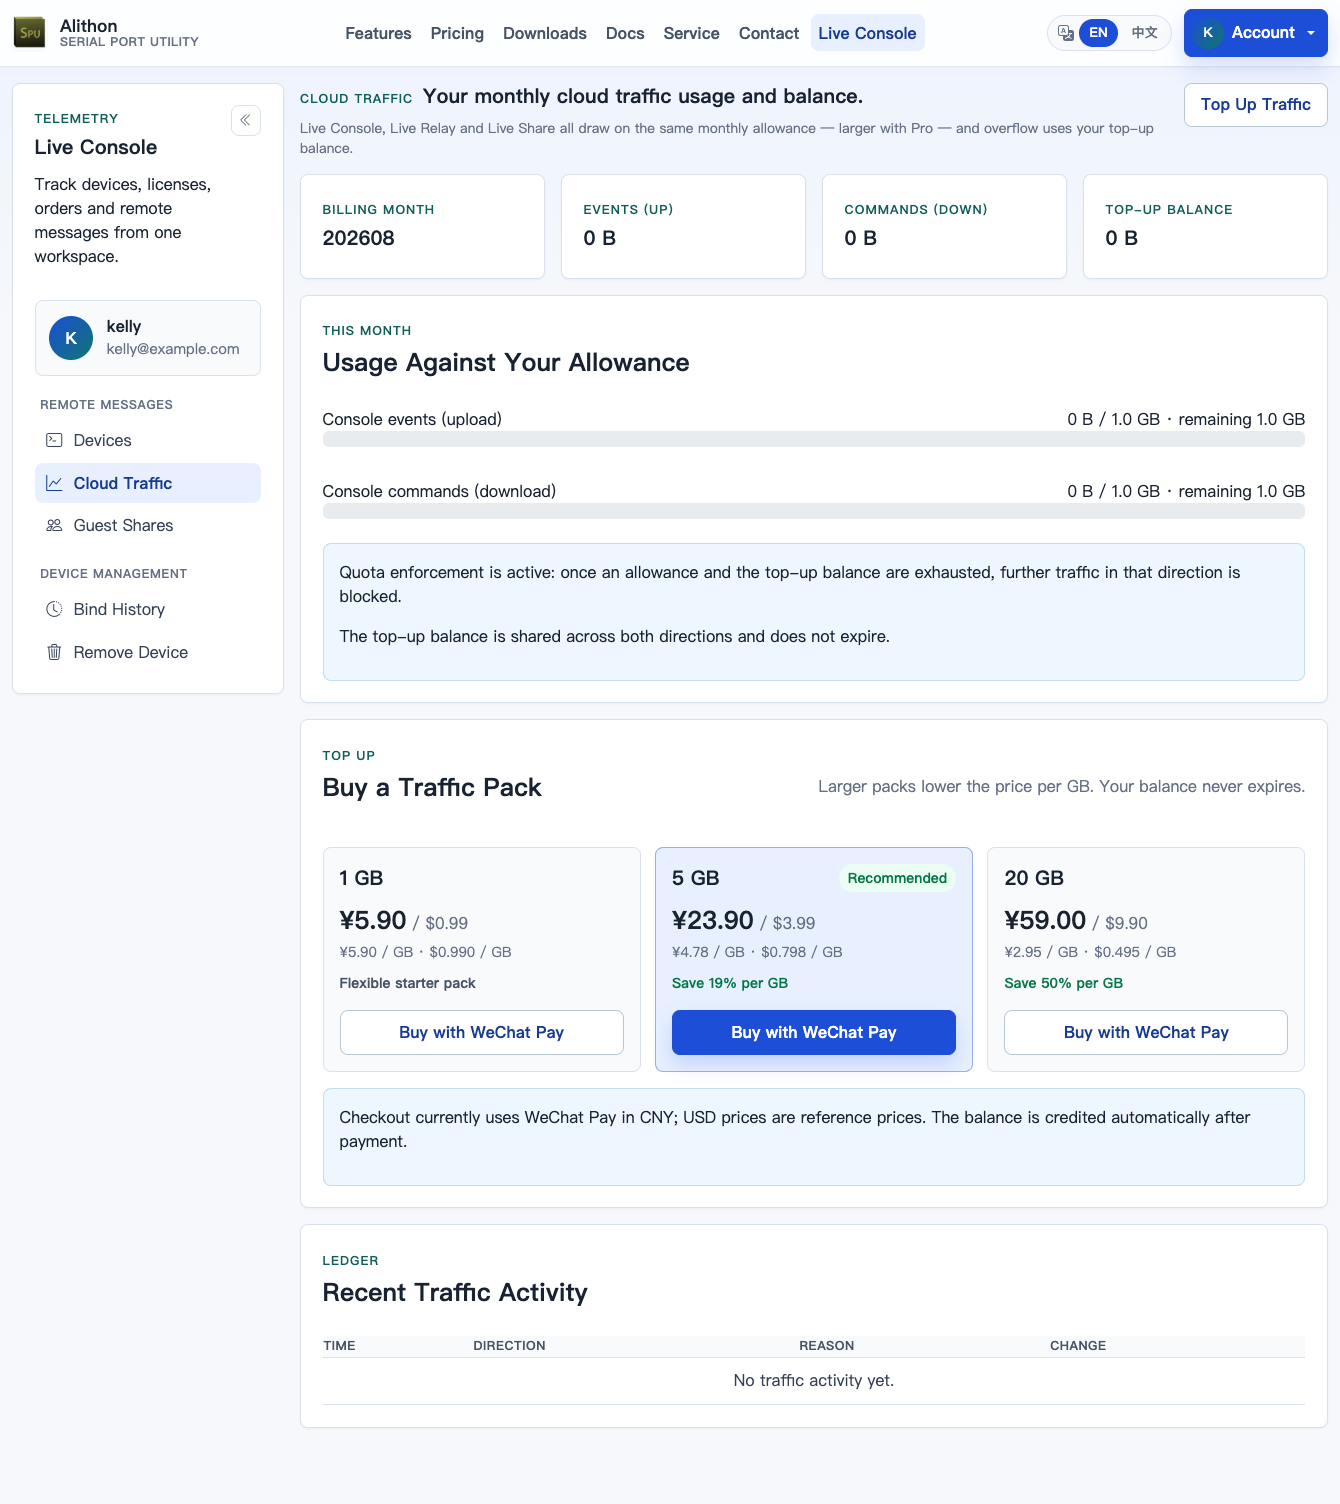
- Console event uploads (up) and remote commands (down) are metered as cloud traffic. Live Console itself does not require Pro — every account can use it. Each direction has a monthly allowance: 10 MB on a free account, 1 GiB with Pro (a paid licence or an active subscription). Overflow draws from your top-up balance, which is shared across both directions and does not expire.
- Usage, ledger and top-ups live on the web "Cloud Traffic" page. With quota enforcement enabled, a direction is refused once the allowance and balance are exhausted, and the desktop switches Live Console off with a top-up prompt.
Security and privacy
- Every remote capability is off by default and must be granted on the desktop machine itself; the web console cannot bypass the desktop switches.
- A guest who enters the web through a Live Share invite code sees only the one port you shared, at the level you fixed when minting it; their data passes through the same short cloud buffer as your own Live Console.
- Signing out stops all cloud features. These data flows are fully disclosed in the Privacy Policy — review it before enabling.